
Seven numbers that describe different things
A Pirots 5 strategy begins with identifying the version and the amount at risk. The provider’s specifications offer several useful numbers, but they do not all measure your chance of profit. A theoretical return, a hit rate, a volatility score and a maximum prize answer different questions. Putting them in one sentence without their definitions makes the game look more predictable than it is.
The following values describe published product information and simple price rules. They are not results measured from a Danish account. The exact RTP selected by a particular operator must be read from the applicable game information. A provider range is a reason to check that setting, not permission to choose its highest number for every review.
| Number | What it describes | What it does not prove |
|---|---|---|
| 87–96% | Published theoretical RTP range | Your operator uses 96% |
| 25.1% | Published hit frequency | 25.1% of purchases are net profitable |
| 7/10 | Provider volatility rating | A 70% chance of a large win |
| 10,000× | Published maximum relative to base bet | A likely session result |
| 3× to 250× | Five X-iter price multipliers | Relative profitability of the modes |
| 7 | Highest gem payout level | A sevenfold complete-round return |
| 3 | Coin-game starting drop count | Exactly three actions in every feature |
A practical note might say: “Pirots 5, Cursed Temple, mode Bonus, base 2 kr, cost 200 kr, displayed RTP checked in game.” That describes a purchase far better than “Pirots 5 at 2 kr.” The latter omits the mode and therefore potentially omits most of the cost. Keep those fields beside any screenshot you later use to discuss a result.
Do not turn a product rating into a probability
The volatility rating uses the provider’s 1–10 scale. It communicates how uneven results can be relative to that scale. It is not a probability percentage, a precise variance or a promise that a certain number of empty rounds will be followed by a large result. A rating of 7/10 cannot be entered as a 70% chance in a calculator.
Likewise, the maximum and maximum exposure are caps. They tell you an upper bound under the product’s rules, not the frequency of reaching it. The information reviewed for this guide does not provide a complete payout distribution. Without that distribution, we cannot calculate an exact probability of doubling a particular bankroll.
RTP is a long-run model, not a refund schedule
RTP means return to player. A theoretical RTP of 96% corresponds to 96 units returned on average per 100 units wagered over the mathematical model’s long run. It does not mean that every block of 100 purchases returns 96% to each player. Short sessions can differ sharply, especially in a game with uneven payments.
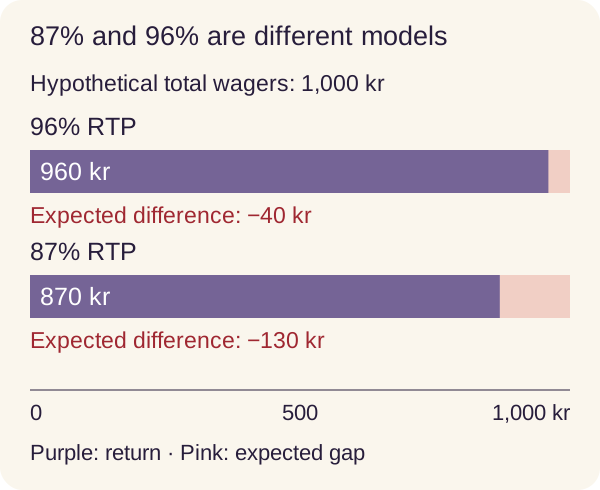
At a hypothetical 1,000 kr of total wagers, 96% gives an expected return of 960 kr and an expected difference of −40 kr. At 87%, the comparable values are 870 kr and −130 kr. The difference between those expected costs is 90 kr. These calculations explain why configuration matters. They do not predict your next balance.
Turnover is not the same as a deposit
A deposit funds an account; turnover adds the actual amounts wagered. Reusing returned funds can make turnover larger than the original deposit. If you place 50 purchases costing 10 kr each, the turnover is 500 kr. That remains true even if the initial balance was smaller and some returns funded later purchases.
For X-iter, use the actual full purchase cost in this total. Ten 20 kr Mega Hunt purchases create 200 kr of turnover, not 20 kr simply because the base bet was 2 kr. Do not mix a base-stake denominator with a full-cost numerator. That can make an observed-return percentage misleading by a large factor.

Why an observed percentage is not the official RTP
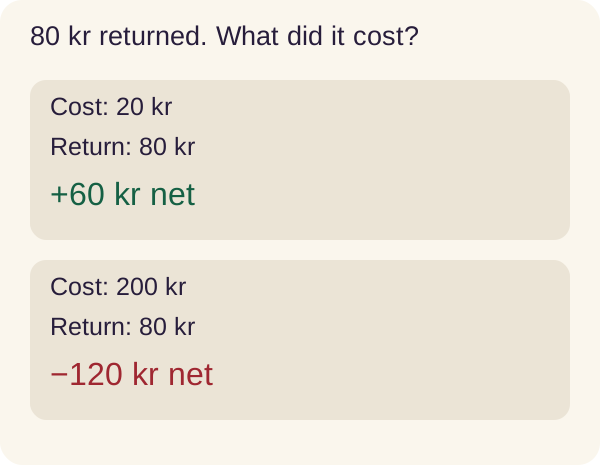
Suppose a teaching example contains 200 kr of settled costs and 240 kr of settled returns. The observed return is 120%, and the net is +40 kr. Another example with 150 kr returned has an observed return of 75% and a net of −50 kr. Both can be calculated without changing a game’s theoretical RTP.
Cursed Temple’s controls became accessible in the public demo check on 6 November. We opened Rules, which listed 96.0% RTP, but made no purchase. There is no settled-round sample or test of Danish network access; a casino can supply another configuration.
A hit can pay money without producing profit
The product sheet gives hit frequency as 25.1%. A hit-rate figure counts an event according to its game definition; it does not automatically count net-positive purchases. The available summary does not provide a detailed classification of every included payment. It should therefore not be rewritten as “a one-in-four chance of making money.”
A small return can be less than the amount paid. A 1 kr payment after a 2 kr purchase is a hit in an ordinary conversational sense, but the net change is −1 kr. Under a 20 kr paid mode, a 12 kr payment still produces −8 kr. A celebration or a nonzero win field does not settle the profit question.
| Arithmetic example | Full cost | Returned | Net result |
|---|---|---|---|
| Small payment | 2 kr | 1 kr | −1 kr |
| Mega Hunt payment | 20 kr | 12 kr | −8 kr |
| Exact break-even | 20 kr | 20 kr | 0 kr |
| Above full cost | 20 kr | 35 kr | +15 kr |
A maximum multiplier needs the same care
The published 10,000× maximum refers to the base bet. If you compare it with a 250× Super Bonus entry, the headline amount is 40 times the entry price. That denominator change does not lower the stated cap or make it easier to reach. It simply puts the cost and return on the same scale.
When watching a winning clip, look for the base bet, selected mode and whether the number shown is a full feature total or an intermediate step. Without those fields, you cannot reconstruct the net result. You also cannot infer the frequency of large wins from a selection of clips chosen because they were unusual.
Progress inside a feature is real, but limited in scope
The documented bonus preserves board size, collection progress and gem levels. Those state changes matter while that bonus continues. They should not be dismissed as if every internal step started from an identical blank board. At the same time, persistence inside a feature does not establish a profitable timing rule for unrelated future purchases.
For any proposed strategy, specify the state it uses. Does it inspect only a previous settled result, or does it refer to progress inside an unfinished feature? Mixing those two situations can create a rule that cannot actually be executed through the normal controls. A valid comparison must use choices that the player can really make.
Four common strategies: what can actually be tested?
1. A fixed full-cost limit
Choose a maximum cost per purchase and a maximum total session spend. Then check whether the selected mode fits both. This can reduce unexpected exposure from a forgotten X-iter selection. It does not improve the game’s RTP. The useful outcome is a controlled amount at risk, not a promise that the remaining purchases are favourable.
For example, a 25 kr per-purchase ceiling allows an illustrative 20 kr Mega Hunt purchase but excludes a 200 kr Bonus purchase. A separate session limit still matters because many smaller purchases add up. State whether a session limit refers to total costs or net losses; those are different amounts when returns are reused.
2. Raising the stake after losses
A doubling rule changes the amounts wagered, not the rules for collecting symbols. Starting with 2 kr and doubling after each loss, the first six consecutive losing purchases cost 2, 4, 8, 16, 32 and 64 kr. Their sum is 126 kr. After those six losses, the next proposed amount is 128 kr, before considering a mode multiplier or the operator’s limits.
This familiar progression also assumes that a later payment can cover previous costs. A slot payment is variable, so a nonzero payment need not recover them. We have not verified a profitable progression on Pirots 5 data. It would be misleading to treat the existence of a doubling formula as evidence that the game can be beaten.
3. Waiting for several low returns
A rule such as “wait for five low returns, then buy Bonus” needs a clear definition of low and a real observation process. Watching free results, watching paid personal results and watching somebody else’s selected clips are not equivalent. A useful test must say which sequence is visible before each decision and what it costs to observe it.
No qualifying Pirots 5 sample has been collected here. We therefore cannot report a winning waiting period or a fitted threshold. A selected historical threshold would still need testing on later untouched data. Finding one that happened to work in the same sample used to select it would not establish future profitability.
4. Switching worlds after a quiet period
The worlds have documented feature differences, which can make switching useful for understanding the game. That is separate from a claim that a quiet period makes another world due to pay. To test such a claim, we would need the actual available choices, state information and complete outcomes. The product sheets alone do not supply that dataset.
Choose a world because you want to understand its features, not because a guide assigns an invented recovery probability. The world comparison explains the specific differences. The calculator helps with cost arithmetic, but deliberately does not label any world or mode as a proven profit strategy.
Use the numbers for a concrete decision
Before a purchase, identify the exact world and configuration, the full price and the amount you are prepared to lose. After settlement, record the total return and calculate the net result. If you cannot see the applicable RTP, keep it unknown. Filling the blank with the provider’s highest available percentage makes the comparison look stronger than the evidence.
For Danish access, verify the operator separately from the game’s provider. If you are using a break or exclusion, follow it rather than looking for a different launch route. ROFUS and StopSpillet are linked below. You can use the explanations and calculators without buying a round.
Why a bell curve is not a ready-made slot model
A bell curve is a symmetric distribution around an average. Individual slot returns need not have that shape. Many outcomes can be small or zero, while rare payments sit far to the right. An average RTP does not tell us the probability of each payout. Drawing a normal curve around 96% would therefore add information that the product sheet does not supply.
Even a simulation needs an explicit outcome model. If we invent the probabilities and then search its results for a profitable setting, the result describes our invented model. It does not establish a setting for the actual game. A useful simulator must disclose which probabilities are assumed and which are measured. Here the calculator performs deterministic price arithmetic instead.
What would justify a future strategy result?
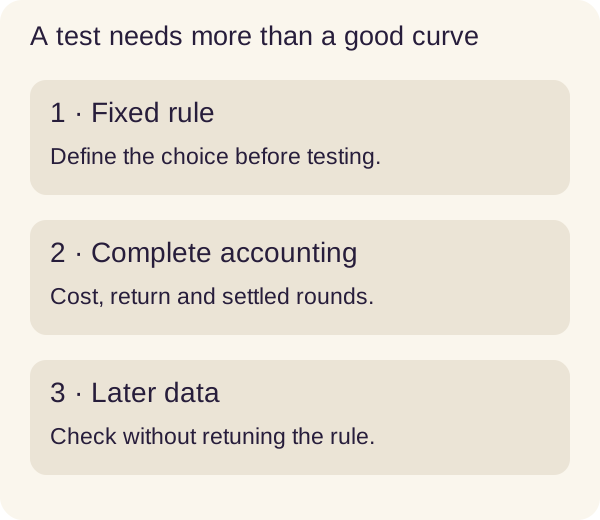
First define the exact rule before the test: observable input, decision timing, mode, stake, maximum exposure and stopping conditions. Then record complete settled purchases, including bonus continuations and all costs. Keep blocked attempts and unresolved outcomes in a separate ledger. Finally, test any selected setting on later data that was not used to choose it.
A confidence interval would also need a suitable statistical method and enough relevant information. We do not report a narrow error margin merely because a sample contains a large number of clicks. Unequal stakes, long features and missing outcomes can all change the interpretation. A transparent small sample is more useful than a precise-looking percentage with an unclear denominator.
A bounded session can finish in profit even when its theoretical expectation is negative. The observed profit is still real within that sample. It describes that completed sequence, while RTP describes the long-run model; neither number should silently replace the other.